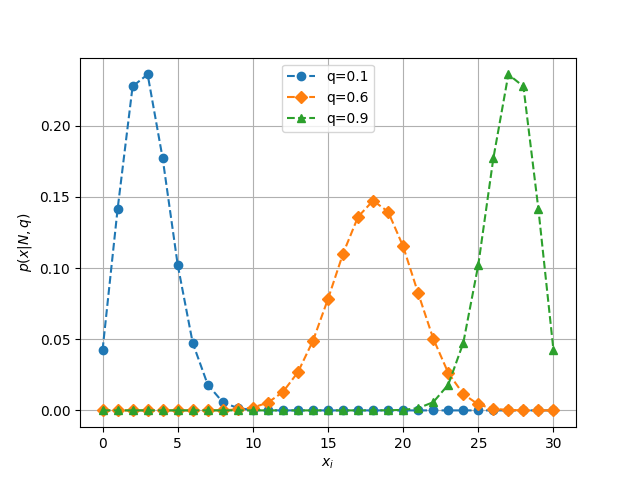
二項分布の計算と分布図
n=30, x=1~30でp=0.1, p=0.6, p=0.9の3通りについて二項分布を計算し、分布図を作成せよ。
import matplotlib.pyplot as plt
import numpy as np
import pandas as pd
from scipy import stats

n = 30
p1, p2, p3 = 0.1, 0.6, 0.9

x = np.arange(0,n+1)
y1 = pd.Series(stats.binom.pmf(x, n, p1), index=x)
y2 = pd.Series(stats.binom.pmf(x, n, p2), index=x)
y3 = pd.Series(stats.binom.pmf(x, n, p3), index=x)

plt.plot(y1, 'o--', label='q=0.1')
plt.plot(y2, 'D--', label='q=0.6')
plt.plot(y3, '^--', label='q=0.9')
plt.legend(loc='upper center')
plt.xlabel('$x_{i}$')
plt.ylabel('$p (x | N, q)$')
plt.grid()
